IELTS Academic Writing Task 1 (Report – Line Graph)
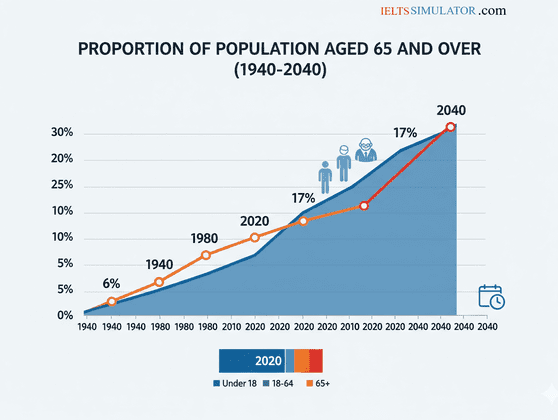
Proportion of the population aged 65 and over between 1940 and 2040
The graph below shows the proportion of the population aged 65 and over between 1940 and 2040 in three different countries.
Summarise the information by selecting and reporting the main feature and make comparisons where relevant.
IELTS in Dehradun Uttarakhand GMS Road BEST coaching in Dehradun
Learn From Experienced Teacher Best IELTS Coaching Dehradun Best IELTS in Dehradun Uttarakhand GMS Road BEST coaching in Dehradun Apply for Class Courses Today Good Results.
8439000086
8439000087
7055710003
7055710004
IELTS Simulation 323 GMS Road, Near Ballupur Chowk, Dehradun, India

email: info at ieltsband7.comBoost Your Score: Practice IELTS Online with IELTS Simulator Prepare for IELTS Effectively Using IELTS Simulator Ace the IELTS: Try Realistic Practice on IELTS Simulator IELTS Simulator: Online Practice to Improve Your IELTS Score Rocky Bay field trip listening practice test has 10 questions belongs to the Leisure & Entertainment subject. Prepare for IELTS IELTS Test International Experienced Teacher Best Training By CELTA Trainer. Best Results Easily Get Required Score IELTS Exam Dates Available, Small Batch Size with Flexible Time, Professional. Easily Get Required Score I am interested in IELTS Pass with Confidence, Dehradun Small Batch Size with Flexible Time, professional faculty. Learn From Experienced Teacher Best IELTS Coaching Dehradun Best IELTS in Dehradun Uttarakhand GMS Road BEST coaching in Dehradun Apply for Class Courses Today Good Results. Small Batch Size, Flexible Time and Professional IELTS Teacher Best IELTS coaching classes IDP certified British Council trained and CELTA certified experienced trainer. Easily Get Required Score Tel:8439000086 Tel:8439000087 Tel:7055710003 Tel:7055710004 Tel:7055710009