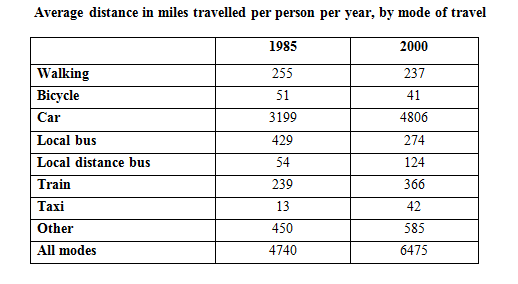
IELTS WRITING TEST SET 2 AC The charts below show the proportions of British students at one university in England who were able to speak other languages in addition to English, in 2000 and 2010. Summarise the information by selecting and reporting the main features, and make comparisons where relevant.…
IELTS WRITING You should spend about 20 minutes on this task. The chart and table below show customer satisfaction levels in the US with airlines and aspects of air travel in 1999, 2000, and 2007. Summarise the information by selecting and reporting the main features, and make comparisons where relevant.…
IELTS WRITING Demand for electricity in England during typical days in winter and summer The graph below shows the demand for electricity in England during typical days in winter and summer. The pie chart shows how electricity is used in an average English home. Summarise the information by selecting and…