IELTS WRITING TEST SET 3 AC
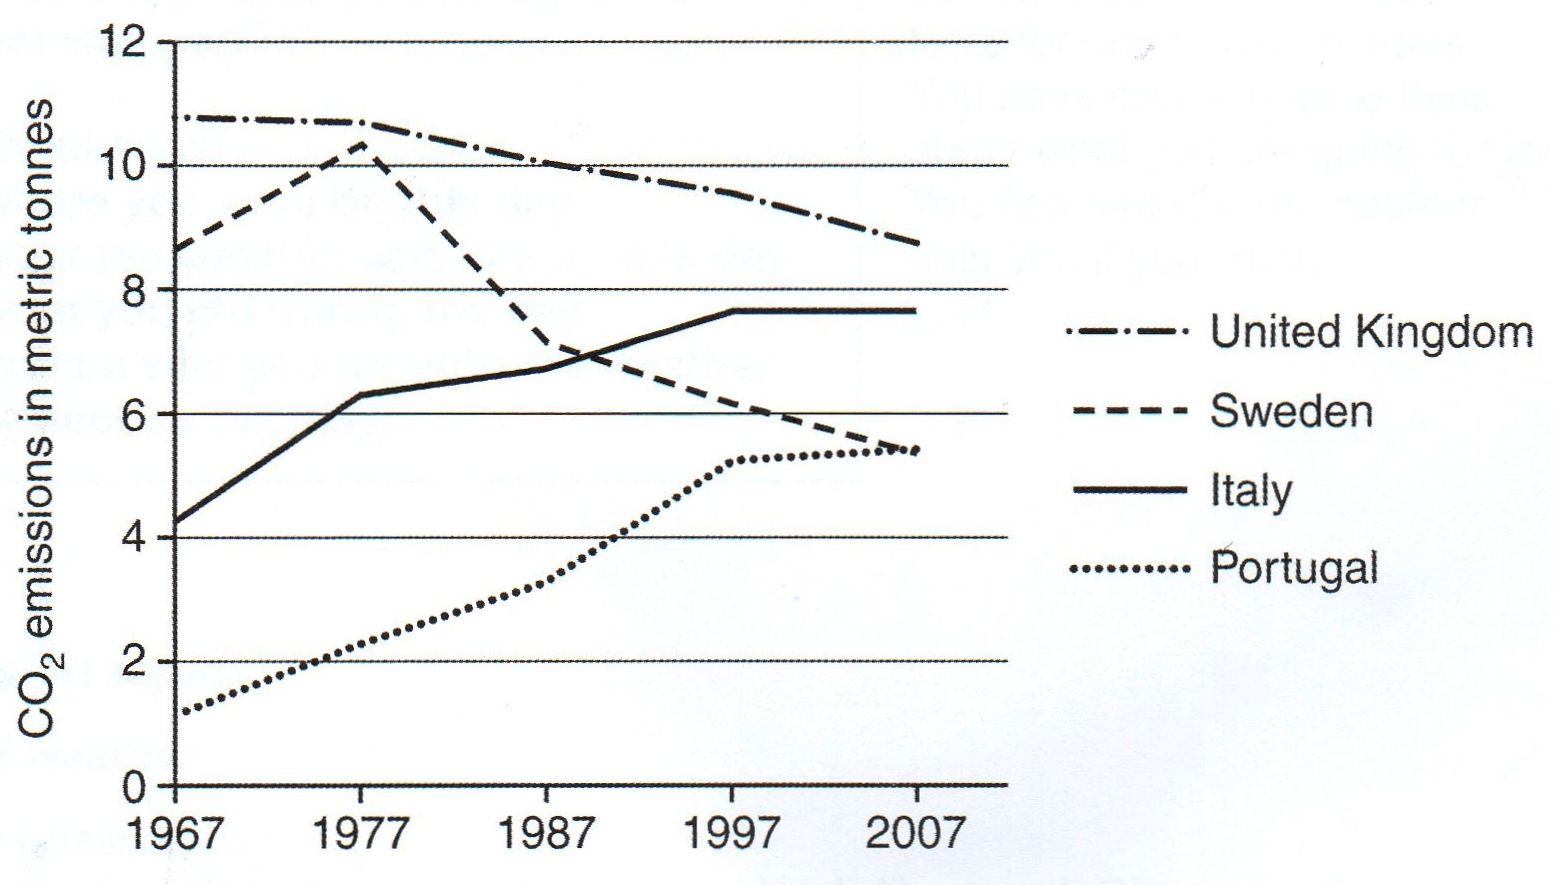
The Graph below shows average carbon dioxide (CO2) emissions per person in the United Kingdom, Sweden, Italy and Portugal between 1967 and 2007.
Summarise the information by selecting and reporting the main features, and make comparisons where relevant.
Average carbon dioxide (CO2)emission per person, 1967-2007
Attempt Full Writing Test…
Find sample answers…